Greening initiatives are sprouting all around the middle east, with very ambitions visions (https://www.greeninitiatives.gov.sa/). But how to measure progress?
Vegetation mapping is conducted with different levels of detail and to answer specific questions in urban, agricultural and natural contexts. Methods vary from vegetation indexes of spectral bands in satellite data through more complex machine learning methods. Generally, vegetation mapping is based on the Normalised Difference Vegetation Index (NDVI) or Land Cover Classification and undertaken at a pixel level. If not combined with elevation data, this method does not distinguish trees, shrubs, and ground cover vegetation. Also, individuals plant cannot be counted as vegetation patches are mapped.
Airborne individual tree detection and delineation is a central task for environmental and urban planning and urban forest management. The increase in data availability and quality provides an opportunity that airborne treemaps can complement traditional ground-based surveys. Most tree delineation approaches in remote sensing use three-dimensional LiDAR data. In contrast, high-resolution RGB data has widespread coverage from commercial and government sources and is readily collected using unmanned aerial vehicles (UAV). As a result, there is an increasing need for RGB-based tree delineation approaches with easy-to-use open-source implementations.
| Various research describes methods, data and associated technology. However, a large-scale application of deep learning in applied science for urban forest management has not been conducted, yet. |
Deep learning is a well-established method for detecting and identifying objects (cats and cars) in RGB images, but it has only recently been applied to vegetation detection. When compared to previous rule-based approaches, deep learning has three features that make it ideal for tree detection.
Use case range from progress and heath tracking of urban or peri-urban vegetation to calculation of ecosystem services in terms of social, financial and environmental benefits (https://www.itreetools.org/).
Google’s Environmental Insights Explorer
The Environmental Insights Explorer (EIE) uses only data sources and modelling capabilities in a freely available platform to help cities measure emission sources, run analyses, and identify strategies to reduce emissions — creating a foundation for effective action.

Google is mapping tree canopy coverage using aerial imagery in Los Angeles. Tree coverage varies across neighbourhoods and developing an understanding of tree locations can inform and inspire action. Google uses planes to collect aerial imagery around the globe to improve Google Maps and Google Earth. In the Tree Canopy Lab, we use this same imagery data to estimate tree canopy coverage across the City of Los Angeles.
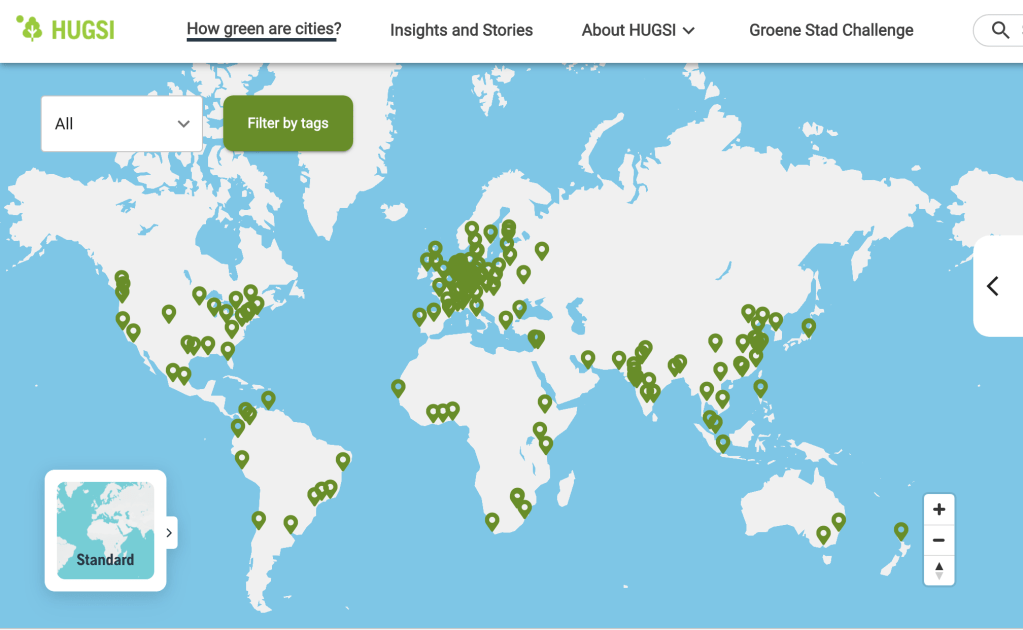
HUGSI (Husqvarna Urban Green Space Index)
A project from the Husqvarna group ranks cities according to their canopy and vegetation cover. HUGSI leverages a combined approach between classical pixel level detection of vegetation and machine learning to distinguish canopy.
Those open data initiatives, obviously contribute to a better understanding of gaps, threats and opportunity of green infrastructure planning. But they may also be guided by other interest. As more municipalities, use data to make cases (and budgets) for greening initiatives data and methods will be developed shared and lead to a much detailed understanding of managed vegetation.

Leave a reply to deep urban forest – data jungle adventures Cancel reply