How can we use on-demand evapotranspiration datasets from Remote Sensing in Riyadh’s urban context? Can we get water consumption for the urban forest in Riyadh?
Urban water management is a growing challenge in arid and semi-arid regions, where water scarcity necessitates precise monitoring and efficient allocation of resources. In Riyadh, a rapidly expanding metropolis in Saudi Arabia, urban greenery—including parks, street trees, and urban forests—plays a crucial role in mitigating extreme heat, improving air quality, and enhancing livability. However, maintaining such vegetation in an environment characterized by high temperatures and limited precipitation requires substantial water input. Evapotranspiration, the combined loss of water through evaporation from soil and transpiration from plants, is a key indicator of water use in vegetated areas. Understanding the actual water consumption of these urban green spaces is essential for sustainable urban planning and resource optimization.
One of the most commonly used models to estimate ET is METRIC (Mapping EvapoTranspiration at High Resolution with Internalized Calibration). Another promising method for estimating water consumption in urban forests is using the recent availability of on-demand ET datasets from satellite observations and geospatial platforms, which allows for the dynamic monitoring of water use at high spatial resolution.
To begin with, we start by exploring the low-resolution data. This blog explores how on-demand ET datasets can be used in Riyadh’s urban forest. Specifically, we aim to address the following questions:
- What are long-term on-demand evapotranspiration datasets from Remote Sensing: SSEBop (2014-2023)?
- How do we use low-resolution datasets to map EvapoTranspiration on the country level (in general) and the urban forest scale in Riyadh City (specifically)?
By integrating remote sensing techniques with urban hydrology, this approach has the potential to support data-driven decision-making for sustainable water resource management in Riyadh.
Long-term On-demand Evapotranspiration Datasets from Remote Sensing: SSEBop (2014-2023)
The Simplified Surface Energy Balance Operational (SSEBop) model (2014–2023) is a remote sensing-based method for estimating actual evapotranspiration (ET) across large areas using satellite data. It belongs to a family of surface energy balance models that streamline the calculation of ET by using fewer input variables and taking advantage of available thermal infrared satellite data.
Key features
SSEBop provides estimates of actual evapotranspiration (ET), a crucial measure of water consumption by vegetation, agriculture, and other land surfaces. It utilizes thermal infrared (TIR) data from satellites such as MODIS (Moderate Resolution Imaging Spectroradiometer), Landsat, and VIIRS (Visible Infrared Imaging Radiometer Suite) to derive land surface temperature (LST) and compute energy balance components.
The model is frequently applied over extended periods (e.g., 2014–2023) to analyze temporal and spatial trends in ET for applications including water resource management, drought monitoring, and agricultural planning. SSEBop simplifies the traditional surface energy balance equation by assuming a constant evaporative fraction (EF), which allows it to estimate ET efficiently on a large scale with minimal input data requirements while maintaining computational efficiency.
Google Earth Engine Script for ET
We compared the ET of several countries using a script on Google Earth Engine using a low-resolution dataset. The script mapped the ET of several countries Saudi Arabia, Gabon, Uganda, Sudan, France, Romania, China, Brazil for two months (2024-01-01 to 2024-01-31) and (2024-08-01 to 2024-08-31) (Figure 1 and Figure 2). This script processes and visualizes evapotranspiration (ET) data from the MODIS MOD16A2 dataset. MOD16A2 reports ET in kg/m², which is numerically equivalent to mm of water lost through evaporation and transpiration. The dataset requires a scale factor of 0.1, so etImageMM = etImage.multiply(0.1) converts ET values to mm/month.
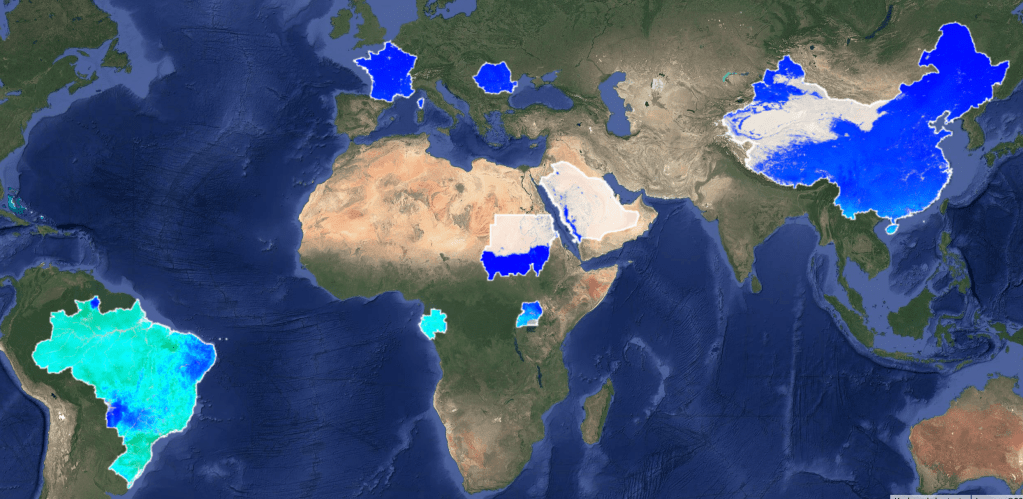

To better understand the map’s colors, the evapotranspiration (ET) visualization in the script uses a color gradient to represent varying levels of water loss. Blue indicates low ET (around 0 mm), typically associated with barren land, urban areas, or dry desert regions where minimal evaporation or transpiration occurs. Cyan represents moderate ET, often found in areas with sparse vegetation, such as shrublands or agricultural zones with limited irrigation. Green reflects higher ET levels, corresponding to regions with more vegetation, irrigated lands, or water bodies where evaporation is more pronounced. Yellow and orange denote high ET, usually observed in well-watered areas, intensively cultivated fields, or regions with significant transpiration. Finally, red represents very high ET (100 mm or more), commonly associated with dense vegetation, heavily irrigated agricultural lands, or water bodies experiencing substantial evaporation.
// Load MODIS MOD16A2 Evapotranspiration dataset
var etDataset = ee.ImageCollection("MODIS/061/MOD16A2")
   .filterDate('2024-01-01', '2024-01-31') // Select August 2024
   .select("ET"); // Select the ET band

// List of countries to process
var countryNames = ['Saudi Arabia', 'Gabon', 'Uganda', 'Sudan','France', 'Romania', 'China', 'Brazil'];

// Load country boundaries from FAO GAUL dataset
var countries = e.FeatureCollection("FAO/GAUL/2015/level0")
   .filter(ee.Filter.inList('ADM0_NAME', countryNames));

// Reduce collection to a median image over the month
var etImage = etDataset.median().clip(countries);

// Convert ET values to mm (MOD16A2 gives ET in kg/m², equivalent to mm)
var etImageMM = etImage.multiply(0.1); // Scale factor for MOD16A2

// Define visualization parameters
var visParams = {
   min: 0,
   max: 150, // Adjust based on expected ET range
   palette: ['blue', 'cyan', 'green', 'yellow', 'orange', 'red']
};

// Add country boundaries for reference
Map.addLayer(countries, {color: 'white'}, 'Country Boundaries');

// Add the ET layer to the map
Map.centerObject(countries, 3); // Zoom out to show all selected countries
Map.addLayer(etImageMM, visParams, "Evapotranspiration (MOD16A2)")
Applicability for Riyadh’s urban forest context
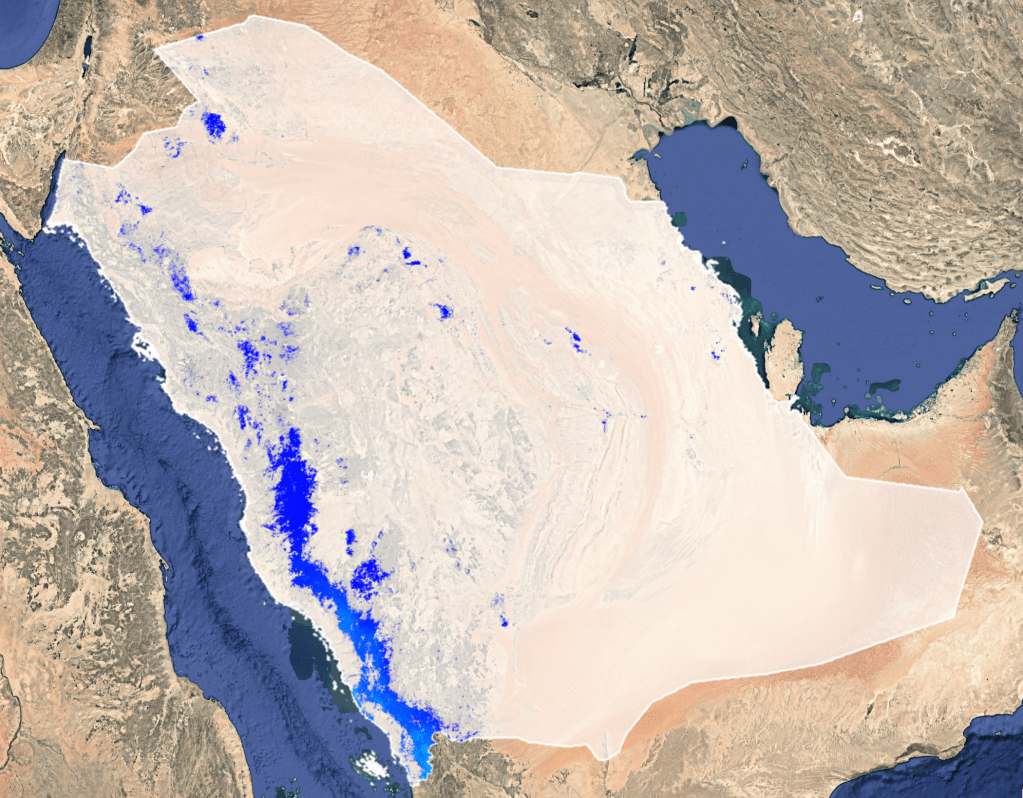
Zooming into the urban scale, specifically Riyadh City in Saudi Arabia (Figure 3), we applied the same script to this area. The main issue observed is the presence of fragmented results scattered across the city. This is likely due to two factors: first, the combination of bare land and urban areas within the same landscape, and second, the relatively coarse spatial resolution of the dataset (500 m), which limits the ability to capture finer-scale variations.
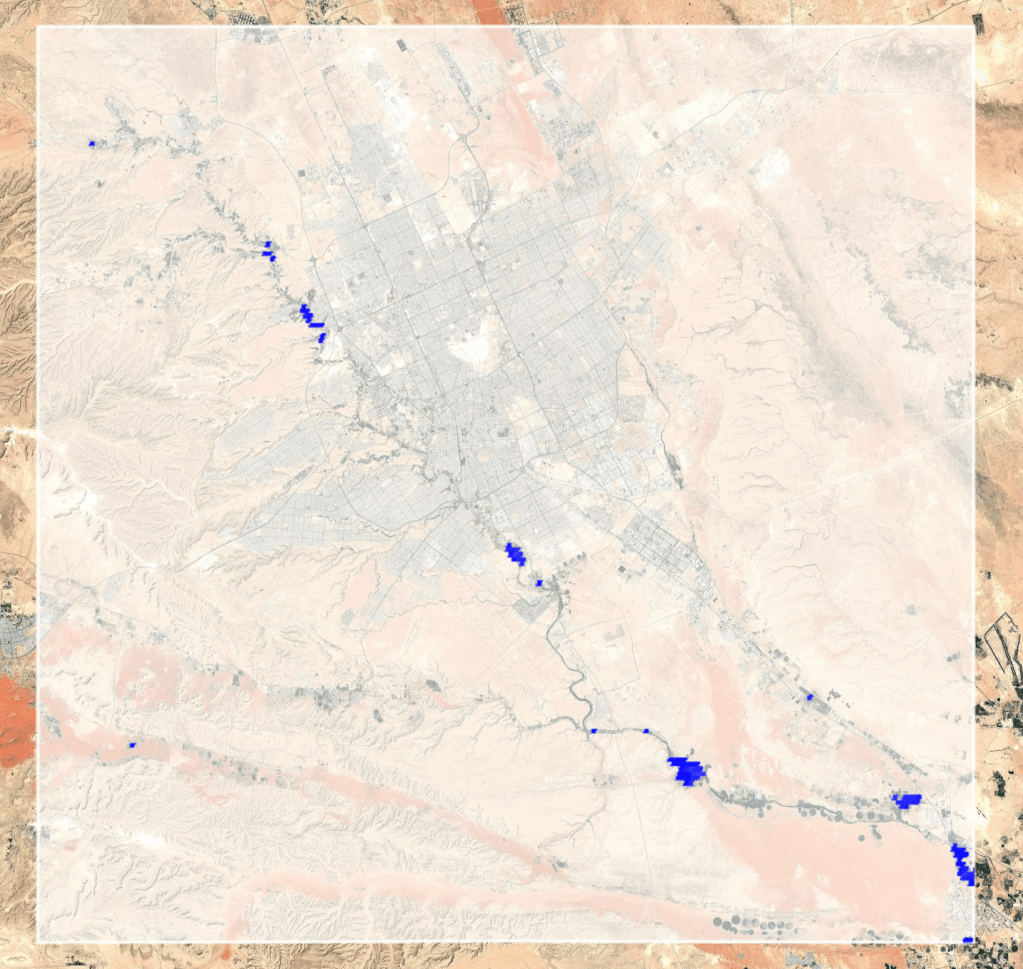
At the city scale (Figure 4), the image suggests that evapotranspiration (ET) is concentrated in specific areas, likely corresponding to Wadi Hanifah in the west of the city. The blue regions in the visualization indicate relatively lower ET values, which may be associated with water bodies, patches of vegetation, or irrigation in an otherwise arid or semi-arid environment. The spatial distribution of ET appears to follow natural drainage paths. Meanwhile, the densely built urban areas exhibit little to no significant ET, which is expected due to the dominance of impervious surfaces such as concrete and asphalt. The limited extent of ET hotspots is attributed either to the coarse resolution of the dataset or to the temporal aggregation (using the median ET for a month) smooths out short-term variations, thereby limiting detailed insights.
The way forward
We will need to downscale the data to address the limitations of city-scale representation and get better results upon which we can build a proper interpretation of the greening strategies applied on the city scale.
Adjustments in resolution should be considered, as the current dataset lacks sufficient granularity. Downscaling (using finer-scale data) could better represent ET patterns at the neighborhood or park scale. This would require switching to higher-resolution ET datasets, such as those derived from Landsat (SSEBop at 30m resolution) or Sentinel-2 thermal-based ET models, which offer finer spatial detail compared to the 500m low-resolution dataset of MODIS MOD16A2. Preliminary unpublished results using SSEBop data indicate the need for further refinement. Therefore, the next step would be to improve and validate the outputs of the SSEBop dataset.

Leave a comment