According to the Food and Agriculture Organisation (FAO), evaporation is when liquid water is converted to water vapour (vaporisation) and removed from the evaporating surface (vapour removal). Water evaporates from various surfaces, such as lakes, rivers, pavements, soils and wet vegetation. Simultaneously, transpiration is the vaporisation of liquid water in plant tissues and the vapour removal to the atmosphere. Knowing that it’s hard to distinguish between the two processes of evaporation and transpiration, it is important to remember that different plant growth stages imply different roles of evaporation and transpiration. In other words:
- At sowing, 100% of evapotranspiration results from evaporation
- At full crop, 90% of evapotranspiration results from transpiration
Evapotranspiration, therefore, is when evaporation and transpiration occur simultaneously. It describes how water is transferred from the Earth’s surface—from bare soil, open water, or vegetation—into the atmosphere. It is influenced by factors such as ambient temperature, humidity, wind speed, solar radiation, and the types of vegetation present. Because it involves both physical and biological processes, evapotranspiration can vary significantly across different ecosystems and climates.
Three Evapotranspiration Conditions
Before moving into how the calculation takes place, different conditions required adjustments to reflect the effect on crop evapotranspiration of the environmental and management conditions in the field. The reason why we have three different evapotranspiration concepts to be clear on.

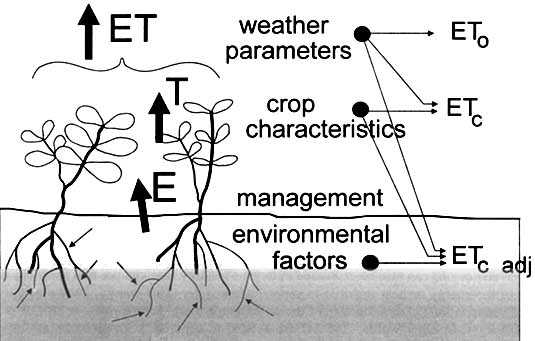
- Reference crop evapotranspiration (ETo): The evaporation power of the atmosphere is expressed by the reference crop evapotranspiration (ETo), representing the evapotranspiration from a standardised vegetated surface.
- Crop evapotranspiration under standard conditions (ETC), is considered when evaluating the evapotranspiration from crops grown in large, well-managed fields. This ETC refers to the evaporating demand from crops grown in large fields under optimum soil water, excellent management and environmental conditions and achieving full production under the given climatic conditions.
- Crop evapotranspiration under non-standard conditions (ETC adj) is when additional consideration is given to management practices acting on the climatic and crop factors affecting the ET process. When field conditions differ from the standard conditions (ETC) then correction factors are needed to adjust ETC. This adjustment would reflect the effects of environmental and management conditions in the field on crop evapotranspiration.
Remote Sensing Calculates Evapotranspiration
Different methods exist for estimating evapotranspiration, each has unique strengths and limitations. Traditional approaches like the Penman-Monteith equation rely on climate data such as temperature, humidity, wind speed, and solar radiation, while lysimeters and eddy covariance towers offer direct, localised measurements of water fluxes, albeit with higher costs and logistical demands. Empirical methods, such as the Hargreaves–Samani or Blaney–Criddle equations, provide simpler alternatives for estimating ET when detailed meteorological data is unavailable. On a different note, remote sensing (RS) offers innovative techniques and methods to calculate evapotranspiration, enabling large-scale assessments that will be discussed further.

A recently published study reviews machine learning (ML) models and influential factors for estimating evapotranspiration (ET) using remote sensing. Amani et al. (2023) explain the mechanisms and background of remote sensing-based evapotranspiration estimation. They review the combination of RS imagery and ML models to estimate evapotranspiration, the most important factors to estimate ET, and the most important satellites for this estimation. Here is an overview based on this study!
Why RS for ET?
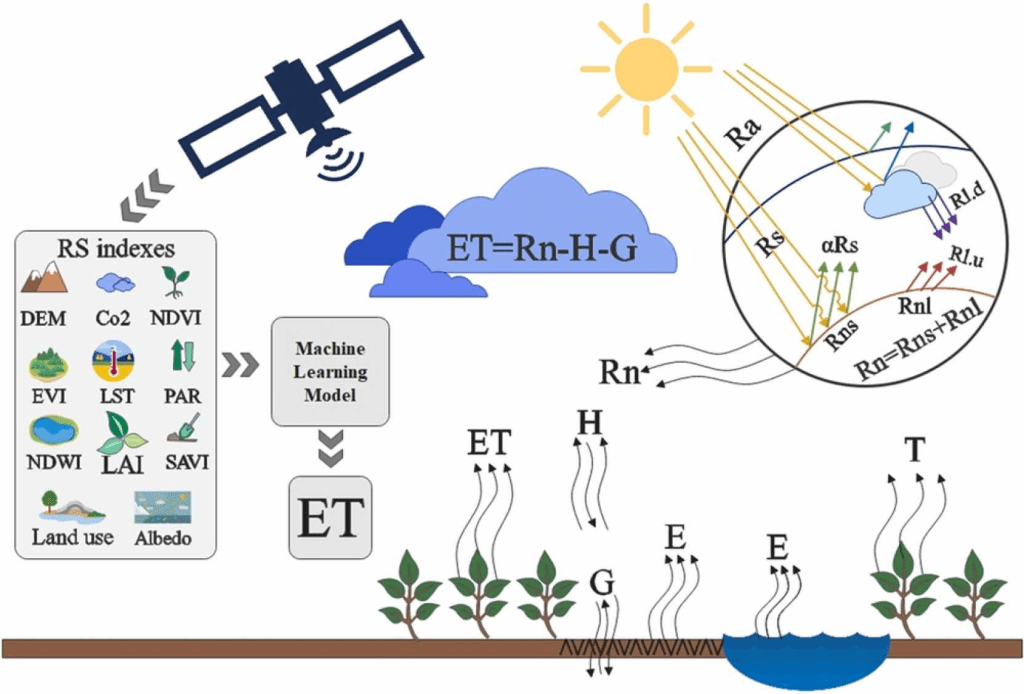
First, to clarify, we estimate evapotranspiration using indirect approaches, such as Land Surface Temperature, vegetation indices, and surface albedo. There is no direct way to deduce ET from RS data. Figure 2 below shows the components of the ET process and factors used to estimate ET using remote sensing data. So, we collect RS data and use it as input for calculating ET, ideally using ML models to save time. Three categories of factors are considered, factors that influence evaporation, factors influencing transpiration, and non-climatic factors such as land cover.
RS imagery and ML models, towards a method
This section discusses the data sources and types of RS imagery and ground observations required for model development. Then, we explore the ML models commonly used in ET estimation.
Accurate selection of input data is crucial for developing an ML model for evapotranspiration (ET) estimation, focusing on data availability and relevance. Key variables influencing ET include:
- climatic variables (temperature, wind speed, humidity, solar radiation),
- soil properties (moisture, texture, crop type),
- and plant characteristics (type, growth stage, leaf shape).
Data sources include ground observations, such as weather stations, flux towers, and global databases (e.g., GLAM, GLASS, GLDAS), as well as remote sensing (RS) data from sensors like MODIS, Landsat, AVHRR/NOAA, GRACE, and Sentinel. Ground and RS data complement each other to enhance ET estimation accuracy.
In this blog, we focus on RS. RS data is collected for certain variables used in ET estimation. This includes the Normalised Difference Vegetation Index (NDVI), Land Surface Temperature (LST), Photosynthetic active radiation (PAR), Leaf Area Index (LAI), Enhanced Vegetation Index (EVI), Surface Albedo, Soil adjusted vegetation index (SAVI), Digital Elevation Model (DEM), Normalised Difference Water Index (NDWI), and land use and land cover (LULC).
The study mentions that more than thirty learning models were used to estimate ET. The three most frequently used were Random Forest (RF), Support Vector Machine (SVM), and Artificial Neural Networks (ANN).
The Random Forest model showed the most effectiveness at the basin level. While using LAI and LST, this model provided accurate values compared to those obtained through MODIS. As for the SVM, it showed good performance in low-data environments. While SVM is sensitive to hyperparameter tuning and computationally expensive for large datasets, it has shown strong performance in explaining ET variations and short-term ET predictions.
ANNs are effective for ET estimation but are computationally intensive, prone to overfitting, and less interpretable. Despite these challenges, ANN-based models often outperform RF and SVM in terms of accuracy and versatility.
What is next?
Now that we’ve explored the methods for calculating evapotranspiration, it’s time to put theory into practice. Next, let’s dive into a proof of concept, demonstrating how remote sensing techniques can be applied to estimate evapotranspiration effectively and at scale to calculate the cooling effect of trees. Two questions may be raised here. How do values differ when comparing ET estimations using RF, SVM, and ANN for the same area? And how do ET values differ across a year for Riyadh City?
Source of featured image: EOS data analytics

Leave a comment