We all know something about satellite data. It comes in different forms and sizes or, better, spatial and temporal resolutions. Wavelengths are captured in other bands; some include surface reflectance, elevation, thermal properties or backscatter.
Stuff visible to the human eye (RGB) is the most comprehensible. Still, many ready-made analysis tools (water, soil, vegetation, temperature) can also be derived easily from open source data.
But then there is drone data, amateur or professional. Most of the drone output is generated through photogrammetry, and the trick is you obtain a visual representation of your backyard and some elevation data.
One comes in a standard raster format, and the elevation stuff is available in an unclassified point cloud. If your surveyor uses a base station or can connect to a local reference station, you will get points with absolut (NN) elevation values. But they are unclassified, as opposed to Lidar which distinguishes ground and non-ground returns.
So the value of a very high-resolution aerial is obvious, and also a DTM, but this irregular point cloud with RGB should not go unnoticed.
Drone Deploy does a lot of processing and object id behind the scene. You can detect stockpiles, but not much else, only on an enterprise plan. It’s a little black box, parametrisation is sparse, and the model(s) do not seem very transferable.
Pix4d does many things ranging from photogrammetry to flight planning and analysis (i.e. ground surface extraction, contours, and TINs.)
There are many other point processing tools (not all open source) and the major GIS software tools are also incorporating more functionality.
Learning Machines
Object detection and segmentation on raster imagery are well known from distinguishing cats and dogs to the generic algorithms available in Google Earth Engine (such as Suport Vector Machines and Random Forests). Trees, cars, buildings and other objects are commonly detected using ML and ArcGIS python, standalone python packages such as Yolo or other tools.

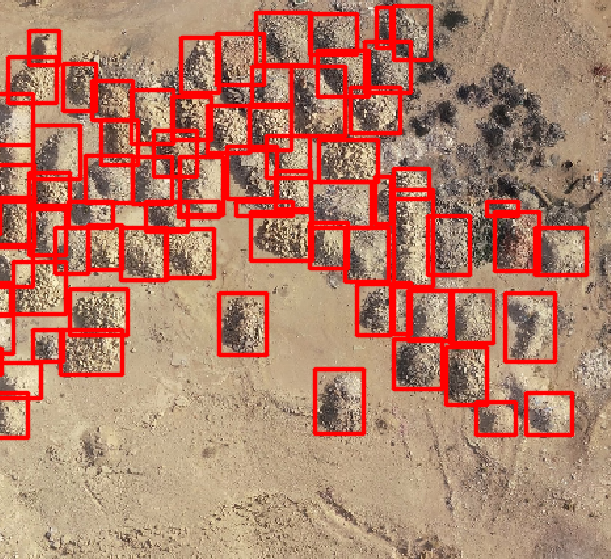
The potential of the point cloud lies in the combo of colour values and 3-dimensional information combined. If you look into multiple datasets, you may also get interested in the temporal axis. Therefore a supervised or non-supervised classification of those points based on their spatial and colour values would help to identify objects.
The GitHub and StackExchange landscape is relatively sparse, either fundamental method research or GUI-based analysis software is returned by our common friend google.
Florent P has an extensive post on medium describing LiDAR point cloud mapping, analysis and mapping in python. Some questions remain open:
- Are there any requirements that a UAV point cloud needs to match for object classification (ie density, RGB,…)? Is there a minimum density? Also are there preferred methods of computing the point from photogrammetry or is the standard drone deploy export sufficient?
- What are suitable packages for object pattern detection point clouds?
We identified a few promising packages such as PointNet2 and graph CNN. Some papers also point toward random forest classifiers for object detection.

PointNet++ allows Deep Hierarchical Feature Learning on Point Sets in a Metric Space but only a single working example has been documented. So let’s investigate PointNet2 for a basic RGB point cloud with approx 30 million points. But first, we will run through the working example which allows to classify shapes based on the point clouds using the GPU and so segment object parts. It seems to support multi GPU and includes visualisation and sematic scene parsing.

Leave a comment